Quantitative research
Introduction
For our research, we were interested to know whether or not the usage of words in literature became more or less extreme depending on the decades that Japan found itself in. In other words, was the usage of words with more extreme connotations influenced by the socio-political situation the country found itself in?
As for what we're looking for, concretely, we want to see how the sentiment scores of words evolved throughout the years. Then, we can look at trends in those scores and try and link them with historical happenings in Japan.
One thing to note, the dataset we used for the sentiment scores of the words contains around 10 times as many words with negative words than scores with positive scores. Naturally, this will be reflected in our visualisation as well.
Limitations
Our research naturally comes with limitations. Firstly, our research is too broad to make concrete connections with specific events. We can make educated guesses, but they are little more than conjecture. Most of these would require specific further research in order to make reliable conclusions. Secondly, our data is considerably limited. Our dataset consists of a little under 1500 books, spread out over 40 years, which means that there are some years with a few books at max. This means that our visualisation isn't very representative for certain years.
Methodology summary
In short, we got the full text of all books from the website Aozora Bunko. From this dataset, we filtered out the books our timeframe of interest (1920-1960), and carried out sentiment analysis on these books using an emotion dictionary we found online. Iterating through all the words in each work, we extracted the 30 most common scores of words, and plotted the scores against their frequency. This gives us the plots in the gifs you can find below. If you're interested in a more thorough explanation, as well as a look into the code we wrote for this project, you can find that here. If you'd like to take a better look at each year of the gifs individually, you can find the frames separated here.
Results
Nouns
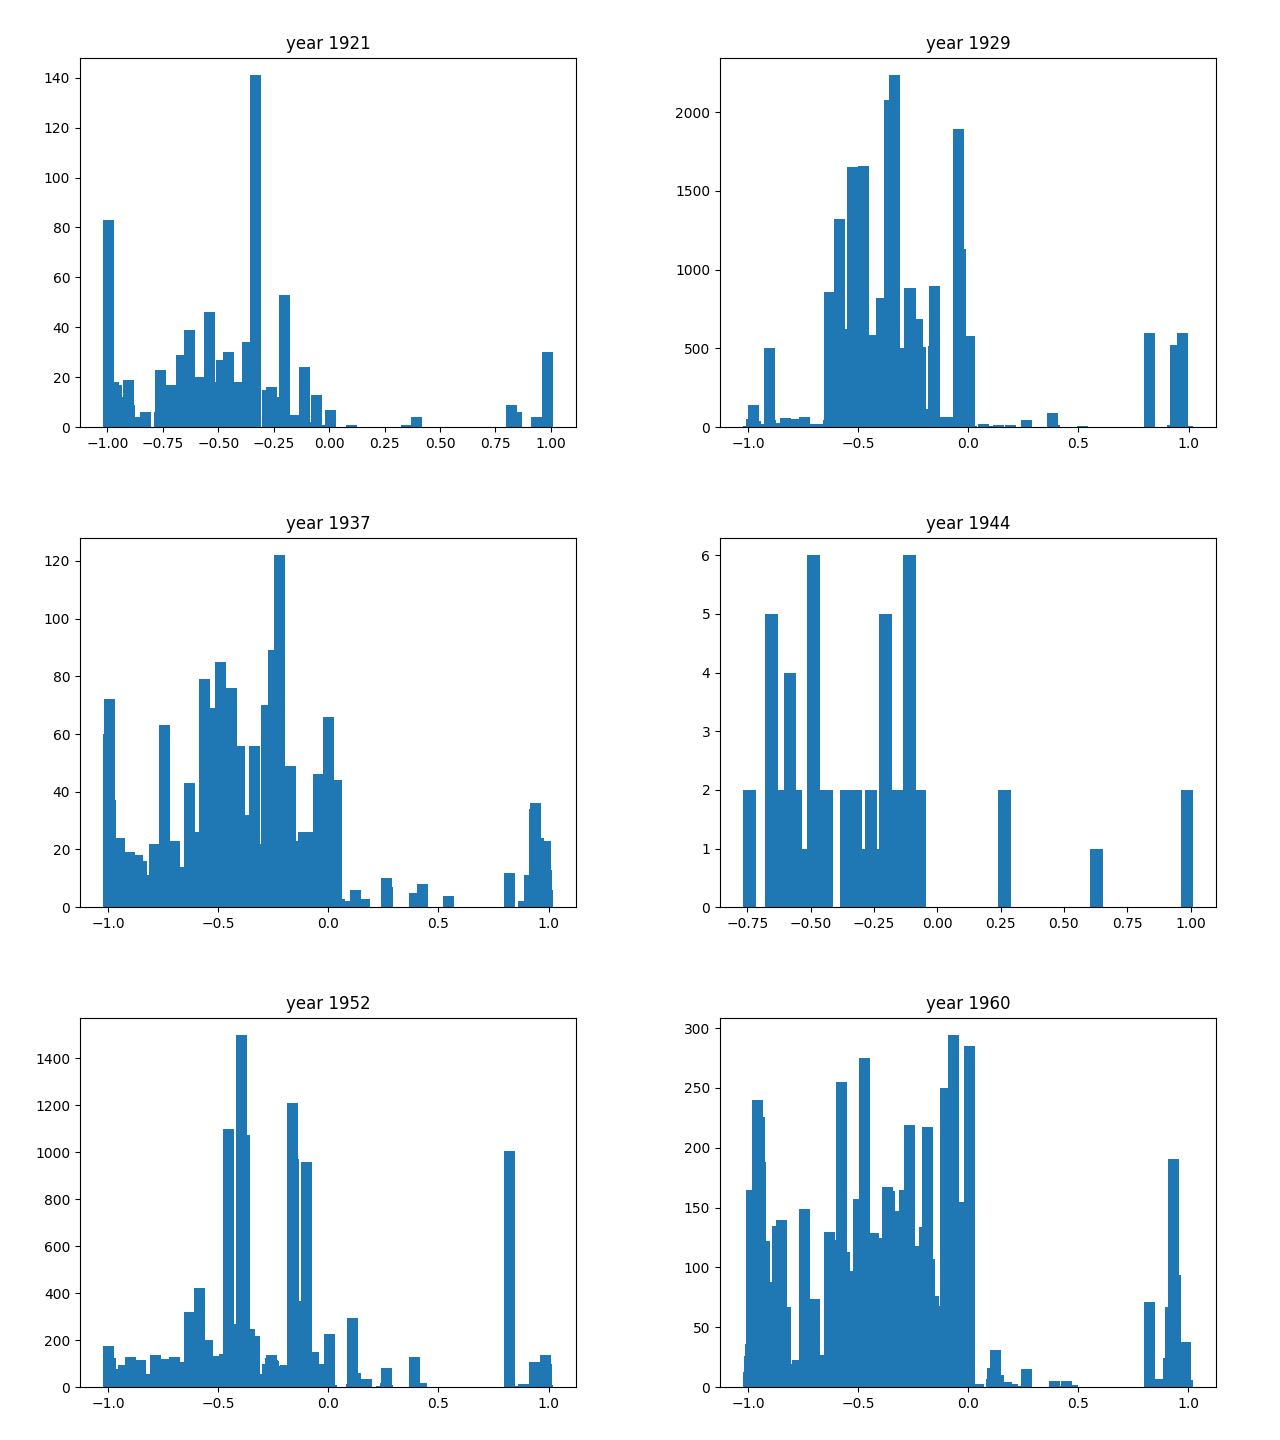
Looking at general trends, the nouns all seem to float around the negative, around -0,5. Comparatively speaking, word use seems to be milder overall, with words at the extremes being much less common than those around the middle. There are some years, like 1940 or 1947, where it seems to shift more towards the extremes.
Verbs
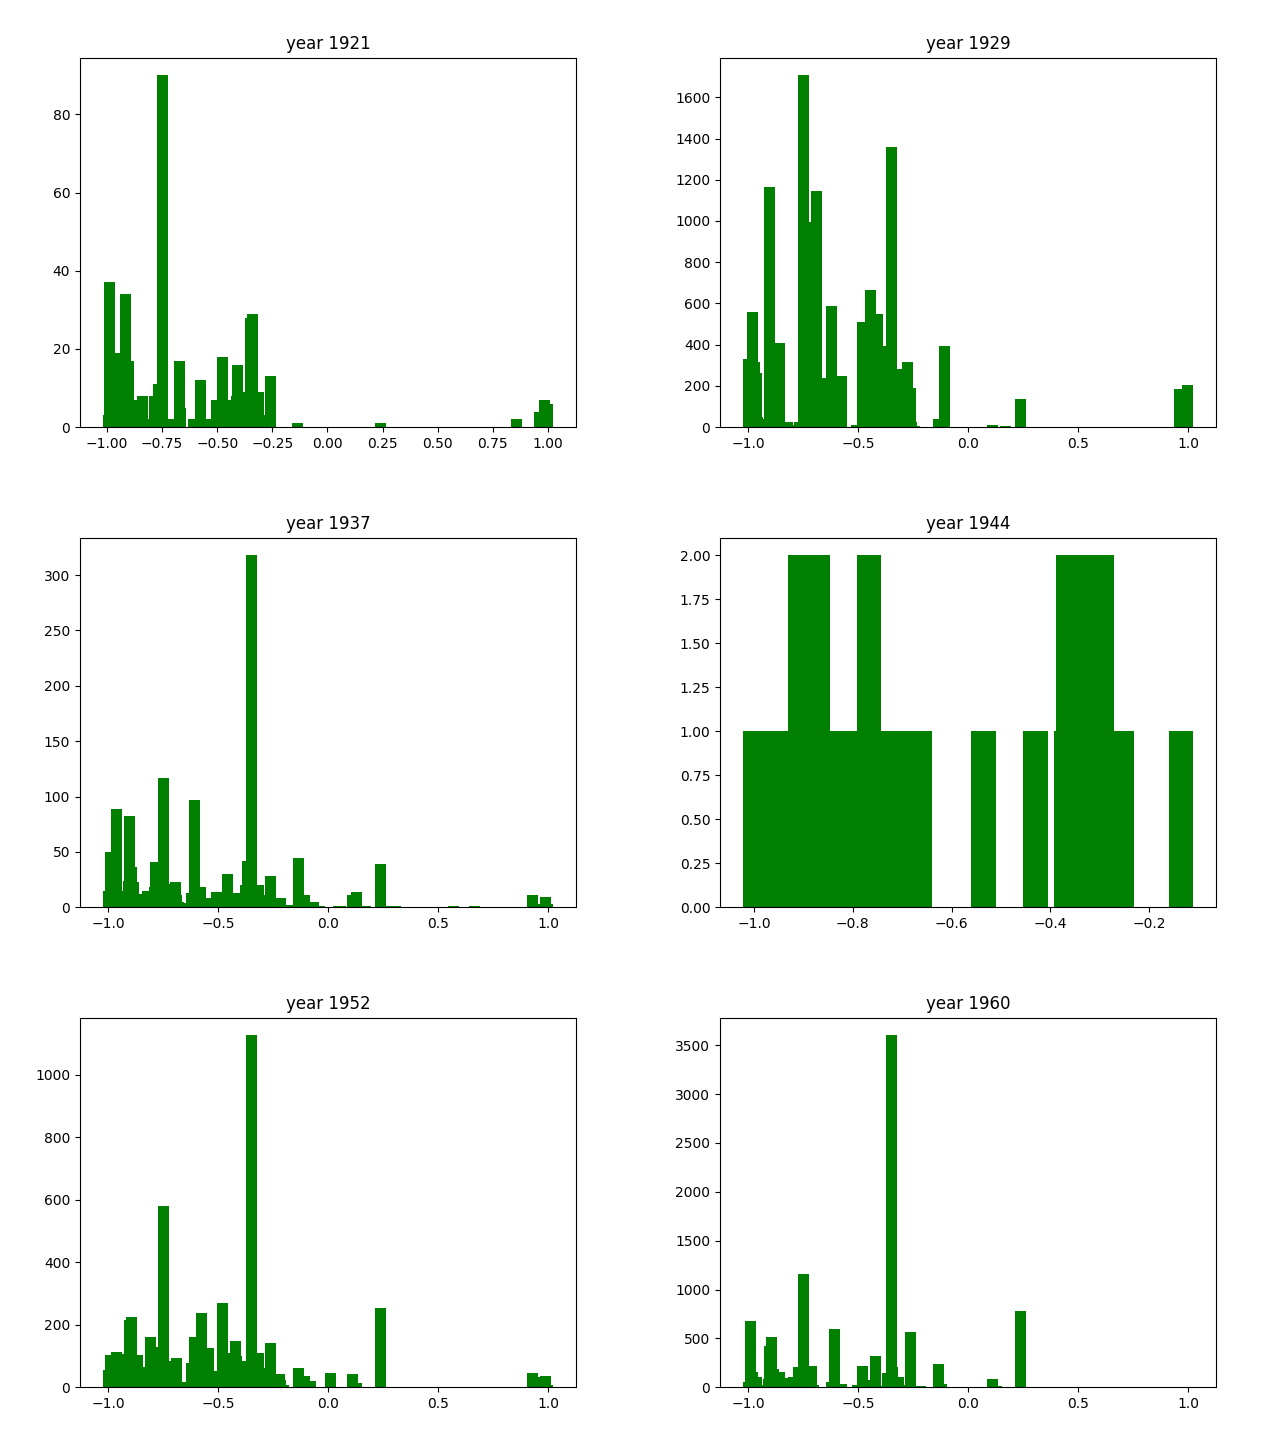
One trend that is easily noticeable is the fact there there is one consistent word that shows up across almost every year. In this case, this is the word iru (いる), which is the word for "being". Considering the way the Japanese language is built, iru is one of the most common words there is. This explains why it's so dominant in the graph.
There are way less positive extremes than negative extremes throughout the years. The reason for that is hard to understand from these numbers alone.
Adjectives
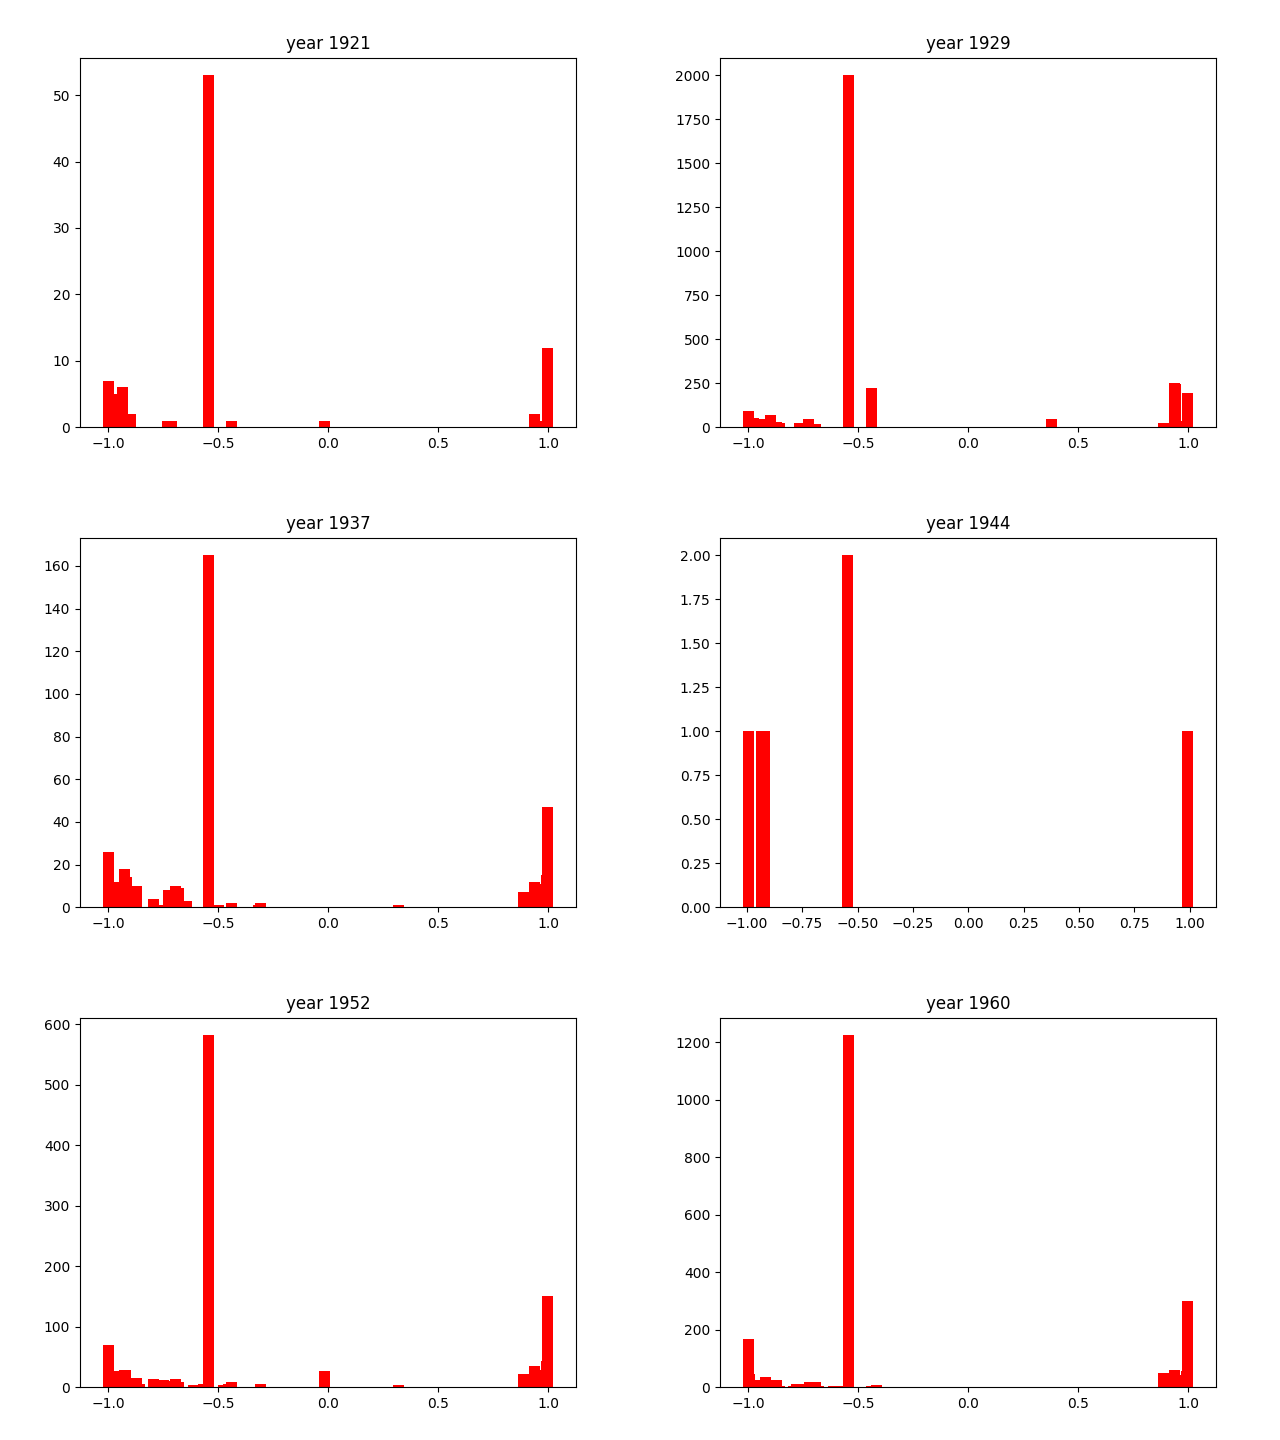
Again, as with the verbs, there is one consistently present word. In this case, it's nai (ない), which is also present in negative conjugations of many words. This is why it shows up so much more frequently than the other adjectives1.
The adjectives seem to be the most consistently distributed throughout the entire timeframe we researched, always hovering around the -1 or +1 extremes. There are little to no cases where they hover more closely to the middle of the score distribution. This might due to the nature of adjectives, that they are intrinsically much more emotionally charged than verbs or nouns.
Discussion
For us, the most notable year was 1943. As you can see in the graph, there were little to no words here: the most common noun was present only 6 times, while for adjectives and verbs it was a measly 2. This is because, at least in our dataset from Aozora, there was only 1 book released that year (you can find it here), which was very short as well (totalling to 1236 characters). The reason for this is that the year prior, the "Japan Publisher's Association" was founded, in which there was a book committee that extensively screened all books that would possibly be published. Due to its link with the government, it's reasonable to assume that the majority of books were prohibited from being published, thus explaining the singular book in this year. However, it is also completely probable that there were many more books this year, and that they simply weren't recorded in Aozora Bunko.
Other than that, there is little information to be gleaned from only these graphs. Trends are hard to pin down and the influence of historical happenings is not really noticeable. This could mean two things:
- Historical events did not have an important influence on the writing style of authors and censorship that was specifically created to alter published texts focused mainly on the contents of the work, rather than the "feeling" of the words in the work
- Our research is not enough to conclude much meaningful information
Unfortunately, checking the first option is quite hard, as we'd need to read many of the books of the dataset and conclude which one is more likely. Given our relatively limited dataset, we're more inclined to the second option.
Conclusion
In conclusion, getting concrete results from our visualisation is rather difficult. Whether it be due to our small dataset, only having one sort of visualisation, or there simply not being a trend is hard to say. It's most likely some combination of the three, but to check that we'd need to conduct further research. Below are some ideas for a possible continuation of our research that we had no time for.
Further research
The most straightforward element to apply would be to not only look at the 30 most common words, but increase that to 100, or even put away with the limit all together. This would increase the computing time somewhat, especially for the plotting of the graphs, but not drastically. We did it this way because, at the time, it seemed like a rather reasonable number, and we didn't want to make it too big that it became unworkable. Another option would be to increase the number of databanks or websites we use, as one is rather little. By doing this, you would need to look out for possible duplicates, but that should be workable with programs like Openrefine. We went with Aozora Bunko because it holds many books with their full text easily accessible, but there could very well be other websites with similar advantages. At first, Aozora seemed like a really good choice considering that there are more than 17 thousand books on there, but unfortunately, in our timeframe there were just under 1500 works. The closer you get to the present, the more books there are that have been recorded somewhere, be it online or physically. It is therefore hard to meaningfully expand the dataset for our timeframe, but it should be doable nonetheless.
If we had more time, making our own emotion dictionary could prove beneficial as well. The emotion dictionary we used has some peculiarites: for example, the word warui (悪い), meaning "bad", is the word with the lowest score of -1, while the word saiaku (最悪), meaning "the worst of all", is less extreme. Naturally, this somewhat goes against what we are looking for, as we are interested in the extremeness of scores. However, we do not have the skills, time, or resources available to us to make such a thing reality at the moment.
Another approach would be to make more visualisations from the data we have, and to clean up said data. Different visualisations could help to piece together trends more easily, if they exist, and would therefore be very beneficial. Different types of sentiment analysis could also be helpful, but for that you'd need different types of emotion dictionaries. One, for example, could work on sentences rather than individual words, or another could categorize words into distinct categories of emotions, which would be easy to plot as well. In short, there are many things that could still be done, had we had more time.
As for the books themselves, we looked at their date of publication, but this is usually a few years off from when it was firstly written. Even though checking this would be immensely difficult, the next stage of this research would be to look at the period when the book was written rather then when it was published.
-
One way to avoid this, and also in the case of iru with the verbs, is to simply take these out of the dataset with sentiments. However, considering we only noticed this after we ran our program, and that said program took almost a full day of running, running it again would take too much time. ↩